
It is no surprise that housing activity slowed in January following a pulling-
forward sales surge as homebuyers hurried to purchase before the mortgage rule
changes in 2018. The January 1 implementation of the new OSFI B-20 regulations
requires that uninsured mortgage borrowers be stress-tested at a mortgage rate
200 basis points above the contract rate at federally regulated financial
institutions.
Statistics released today by the Canadian Real Estate Association (CREA)
show that housing activity retreated to the lowest monthly level in three years
in January. Sales were down in three-quarters of all local markets, including
virtually all major urban centres. Many of the larger declines in percentage
terms were posted in Greater Golden Horseshoe (GGH) markets, where sales
had picked up late last year following the announcement of tighter mortgage
rules coming into effect in January.
Actual (not seasonally adjusted) activity was down 2.4% from January 2017
and stood close the 10-year average for January. Sales came in below year-
ago levels in about half of all local markets, led by those in the GGH region.
By contrast, sales were up on a year-over-year (y-o-y) basis in the Lower
Mainland of British Columbia and Vancouver Island, the Okanagan Region,
Edmonton, Montreal, Greater Moncton and Halifax-Dartmouth.
According to the CREA President Andrew Peck, "The piling on of yet more
mortgage rule changes that took effect starting New Year's Day has created
homebuyer uncertainty and confusion. At the same time, the changes do
nothing to address government concerns about home prices that stem from
an ongoing supply shortage in major markets like Vancouver and Toronto.
Unless these supply shortages are addressed, concerns will persist."
New Listings Fall Sharply
The number of newly listed homes plunged 21.6% in January to reach the
lowest level since the spring of 2009. New supply was down in about 85% of
all local markets, led by a sizeable decline in the GTA. Large percentage
declines were also recorded in the Lower Mainland of British Columbia and
Vancouver Island, the Okanagan Region, Hamilton-Burlington, Oakville-
Milton, Kitchener-Waterloo, London and St. Thomas, Kingston and Ottawa,
closely mirroring the list of markets that saw the most significant sales
declines in January.
With new listings having fallen by more than sales, the national sales-to-new
listings ratio tightened to 63.6% in January compared to the mid-to-high 50%
range to which it held since last May.
A national sales-to-new listings ratio of between 40% and 60% is generally
consistent with a balanced national housing market, with readings below and
above this range indicating buyers' and sellers' markets respectively. That
said, the balanced range can vary among local markets.
Based on a comparison of the sales-to-new listings ratio with its long-term
average, a little over half of all local markets were in balanced market
territory in January 2018. The ratio in many markets moved one standard
deviation or more above its long-term average in January due to large
declines in new supply.
The number of months of inventory is another important measure of the
balance between housing supply and demand. It represents how long it would
take to liquidate current inventories at the current rate of sales activity.
There were 5 months of inventory on a national basis at the end of January
2018, which is close to the long-term average of 5.2 months.


The Aggregate Composite MLS® Home Price Index (HPI) rose by 7.7% y-o-y
in January 2018. January's annual price increase was the 9th
consecutive deceleration in y-o-y gains, continuing a trend that
began last spring. It was also the smallest y-o-y increase since
December 2015. The MLS® Home Price Index (MLS® HPI) provides the
best way of gauging price trends because average price trends are prone to be
strongly distorted by changes in the mix of sales activity from one month to
the next
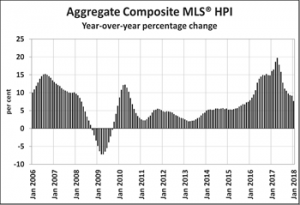
The deceleration in y-o-y price gains mainly reflects trends among
GGH housing markets (the broad region surrounding Toronto)
tracked by the index. While prices in the area have primarily
stabilized in recent months, ongoing deceleration in y-o-y
comparisons reflects the rapid rise in prices one year ago.
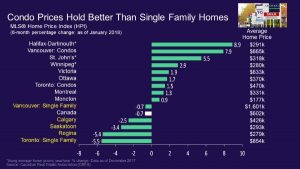
Apartment units again posted the most significant y-o-y price gains in
January (+20.1%), followed by townhouse/row units (+12.3%), one-storey
single family homes (+4.3%), and two-storey single family homes (+2.3%).
Composite benchmark home prices in the Lower Mainland of British
Columbia continue to trend higher after having dipped briefly during the
second half of 2016 (Greater Vancouver: +16.6% y-o-y; Fraser Valley: +22.4%
y-o-y). Apartment units have been driving this regional trend in recent
months, with single family home prices stable.
Benchmark home prices rose by about 14% on a y-o-y basis in Victoria and by
about 20% elsewhere on Vancouver Island. These gains are similar to those
recorded during the fourth quarter of last year.
Price gains have slowed considerably on a y-o-y basis in the GTA, Guelph,
and Oakville-Milton; however, home prices in the former two markets remain
above year-ago levels (GTA: +5.2% y o-y; Guelph: +10.9% y-o-y; Oakville-
Milton: -1.2% y-o-y). Monthly prices in these markets have shown signs of
stabilizing in recent months after having climbed rapidly in early 2017 and
subsequently retreated.
Calgary benchmark home prices were down slightly (-0.5% y-o-y), as were
home prices in Regina and Saskatoon (-4.9% y-o-y and -4.1% y-o-y,
respectively).
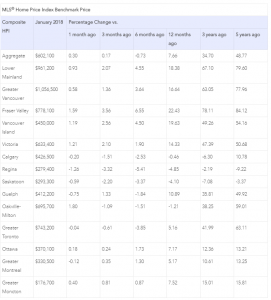
Benchmark home prices rose by 7.2% y-o-y in Ottawa (led by an 8.1%
increase in two-storey single family home prices), by 5.2% in Greater
Montreal (led by a 6.2% increase in in two-storey single family home prices)
and by 7.5% in Greater Moncton (driven by an 11% increase in one-storey
single family home prices). (Table below).
Dr. Sherry Cooper
 When I started working as a broker in 2005, the mortgage industry and the financial industry in general weren’t very eco-friendly. Let’s face it. When someone buys a home, there’s a paper trail. Starting with the mortgage pre-approval which can run four pages, the Offer to Purchase, which is another 12 pages, income documents, notices of assessment, appraisal, and MLS listing condo documentation to add to the pile of paper. Often you would end up with a stack of paper 50-60 pages high. I needed a copy, the lender needed a copy and then my broker needed to keep a copy on file for seven years. I found that I was going to Staples and buying a case of 5,000 sheets of paper every year. I recall going to my broker’s office and seeing the admin assistant struggling to find a place to put another big box of files as the storage room was full.